The functionality Modify a chartfeature on the K inventory software makes it easy to customize graphs by modifying the title, report template, display format and data sources.
This feature is only available on the Web version.
1. In the left-hand menu, click on the Reports 
2. Click on the  icon of a graph, then on the Edit icon
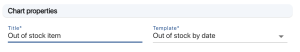
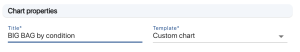
3. In the Graphic properties section of the Modify graph window, you can modify :
- The title
- The report template
- Display format (for custom graphics only)
- Data sources (for Custom Graphics only)
Model graphics
Custom graphics
Depending on the type of chart (Chart with default template or Custom chart) you can modify different fields:
In the Chart data, for a default model you can modify :
- The files
- Categories
- (Optional) References
For a custom graphic you can modify it:
- Horizontal axis data
- The legend
- Measurement value
- Type of measurement
4. In the Custom filters, the fields below can be modified:
- In the Folder field, change the location(s) on which data will be filtered
- In the Categories field, modify the reference category(ies)
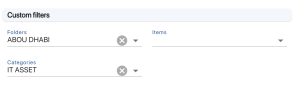
Customized filters section
5. In the Dates sectionTo compare two periods on a graph, in the Dates section, click on  and select a second period for comparison.
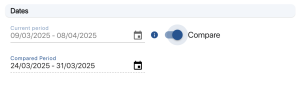
Selecting periods to compare
6. Save your changes by clicking on the Save
4. In the Graphic propertiessection, modify the Display format
Different displays are available to suit different graphics.
- Columns
- Curves
- Lines
- Sectors
- Table
- Text

Display format
5. In the Graphic propertiessection, modify the Data source
Various sources of data are available for better monitoring of activity:
- References (products + equipment)
- Products
- Equipment
- Interventions
- Controls
- Order items
- Transactions
- Transactions (entries)
- Transactions (outputs)

Data sources
6. In the Chart data section, edit the fields:
- Horizontal axis data
- Legend
- Measurement value
- Measurement type
- The field Horizontal axis data field divides the data according to a criterion.
For example, this allows you to display imported part numbers day by day, or by category
- The Legend field can be used to select a measurement separation criterion, such as the category
In this way, it is possible to view the import of references day by day, with a curve for each category.
- The field Measurement value field is used to select the criterion to be measured, such as the quantity or alert threshold of imported references.
- The field Type of measurement field is used to change the calculation mode
In number mode, the number of imported references is counted, while in sum mode the total quantity is calculated.
7. To add a location filter, complete the field Locations field in Custom filters
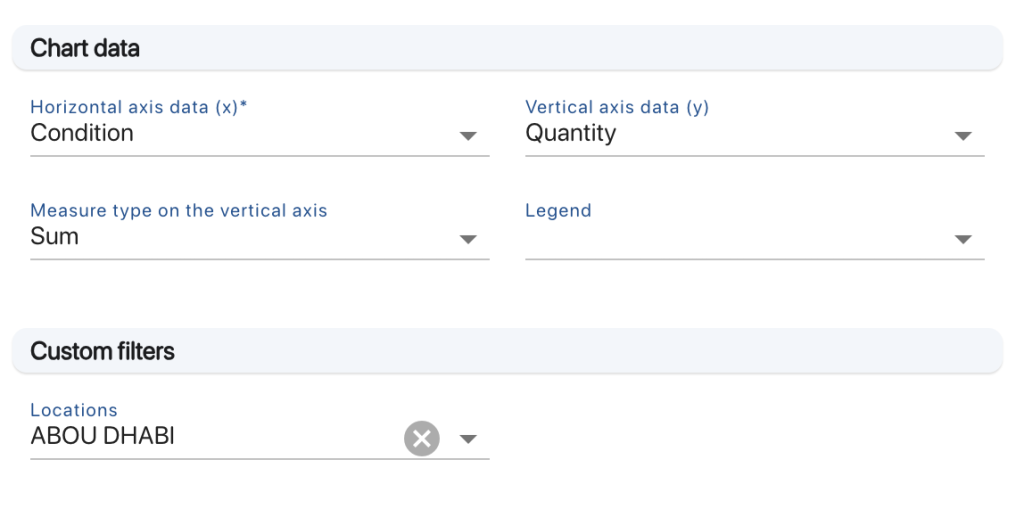
Filter on product location
8. To optimize the filters applied to the graph, click on the Advanced filters tab, then modify the advanced filter
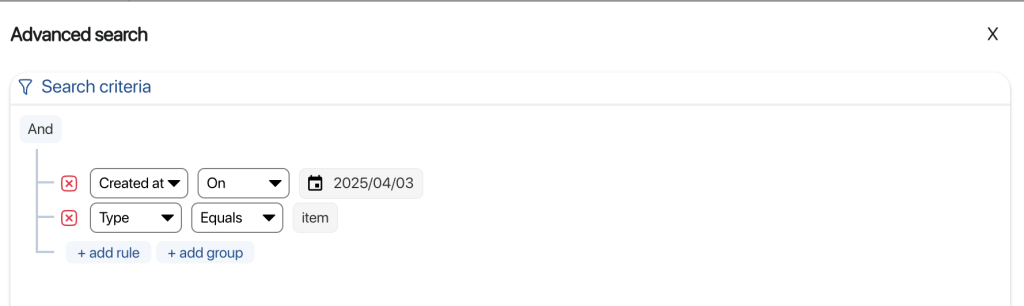
Advanced filter example
You can compare with a fixed value or in relation to the data in a field.
In the following example, the filter value should be equal to Alert threshold for sending to be validated
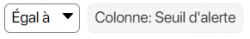
Column condition
To switch from one type of reference value to the other, click on the  or
or 
To create the filter in the example above
- Select Alert threshold, then Above
- Click on the Sort by field to compare data for two fields (Alert Threshold and Product Quantity)
- select Quantity
For more information on managing advanced filters, click on this link
9. Save your changes with the Save button
-
Default model
-
4. In the Custom filters, the fields below can be modified:
- In the Folder field, change the location(s) on which data will be filtered
- In the Categories field, modify the reference category(ies)
Customized filters section
5. In the Dates sectionTo compare two periods on a graph, in the Dates section, click on and select a second period for comparison.
Selecting periods to compare
6. Save your changes by clicking on the Save
-
Customized model
-
4. In the Graphic propertiessection, modify the Display format
Different displays are available to suit different graphics.
- Columns
- Curves
- Lines
- Sectors
- Table
- Text
Display format
5. In the Graphic propertiessection, modify the Data source
Various sources of data are available for better monitoring of activity:
- References (products + equipment)
- Products
- Equipment
- Interventions
- Controls
- Order items
- Transactions
- Transactions (entries)
- Transactions (outputs)
Data sources
6. In the Chart data section, edit the fields:
- Horizontal axis data
- Legend
- Measurement value
- Measurement type
- The field Horizontal axis data field divides the data according to a criterion.
For example, this allows you to display imported part numbers day by day, or by category
- The Legend field can be used to select a measurement separation criterion, such as the category
In this way, it is possible to view the import of references day by day, with a curve for each category.
- The field Measurement value field is used to select the criterion to be measured, such as the quantity or alert threshold of imported references.
- The field Type of measurement field is used to change the calculation mode
In number mode, the number of imported references is counted, while in sum mode the total quantity is calculated.
7. To add a location filter, complete the field Locations field in Custom filters
Filter on product location
8. To optimize the filters applied to the graph, click on the Advanced filters tab, then modify the advanced filter
Advanced filter example
You can compare with a fixed value or in relation to the data in a field.
In the following example, the filter value should be equal to Alert threshold for sending to be validated
Column condition
To switch from one type of reference value to the other, click on the or
To create the filter in the example above
- Select Alert threshold, then Above
- Click on the Sort by field to compare data for two fields (Alert Threshold and Product Quantity)
- select Quantity
For more information on managing advanced filters, click on this link
9. Save your changes with the Save button
To continue browsing, here are a few articles related to this page: