The functionality Hide chartfunction in K inventory’s online inventory management software enables you to suppress the display of a chart from a dashboard’s edit panel, or directly from the chart concerned.
There are two ways to hide the display of a chart: from a dashboard’s edit panel, or directly from the chart itself.
FIRST METHOD
1. In the left-hand menu, click on the Reports ![]()

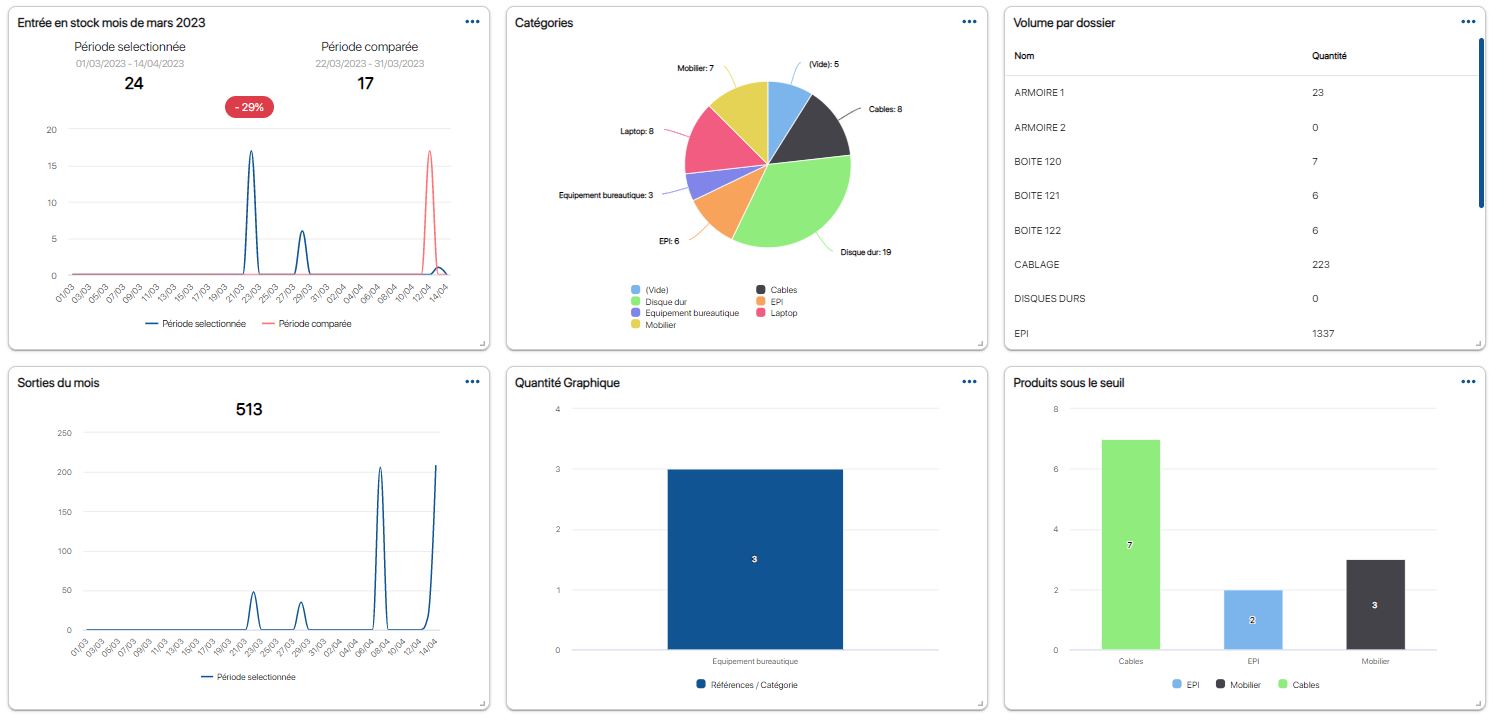
Default dashboard
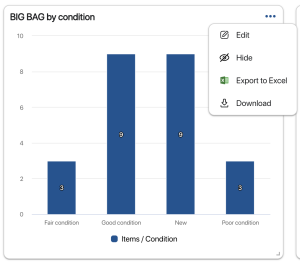
2. Click on the ![]() icon of the graphic to be hidden, then on
icon of the graphic to be hidden, then on ![]()

Hides a graphic
SECOND METHOD
1. In the left-hand menu, click on the Reports
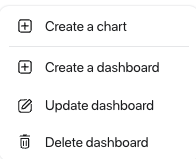
2. Click on Dashboard at the top left of the screen, then on Modify dashboard

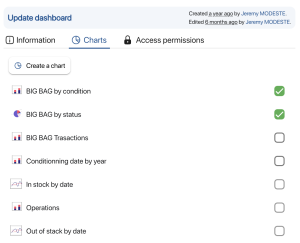
Modifying a dashboard
3. Click on the Graphics tab, then uncheck the checkbox of a chart in the

List of available graphics
4. Save your changes with the Save
To continue browsing, here are a few articles related to this page: